Help / Documentation
Image analysis
{username}_{screentype}_{query}_{arrayplateid}.... usernameis the name of the person who carried out the experiment,screentypeis the type of screen carried, wherewtorctrldenotes a control screen, and any other value represents a case screen (double mutant, mutant / drug combination, ...)queryis the name of the query used in the experimentarrayplateida value indicating the array plate id, used to map the file to its plate layout file. In a typical SGA yeast screen, this value ranges from 1-14
Below are examples of the two known modes of failure for segmentation. We are working on improving SGAtools to handle these cases as well.
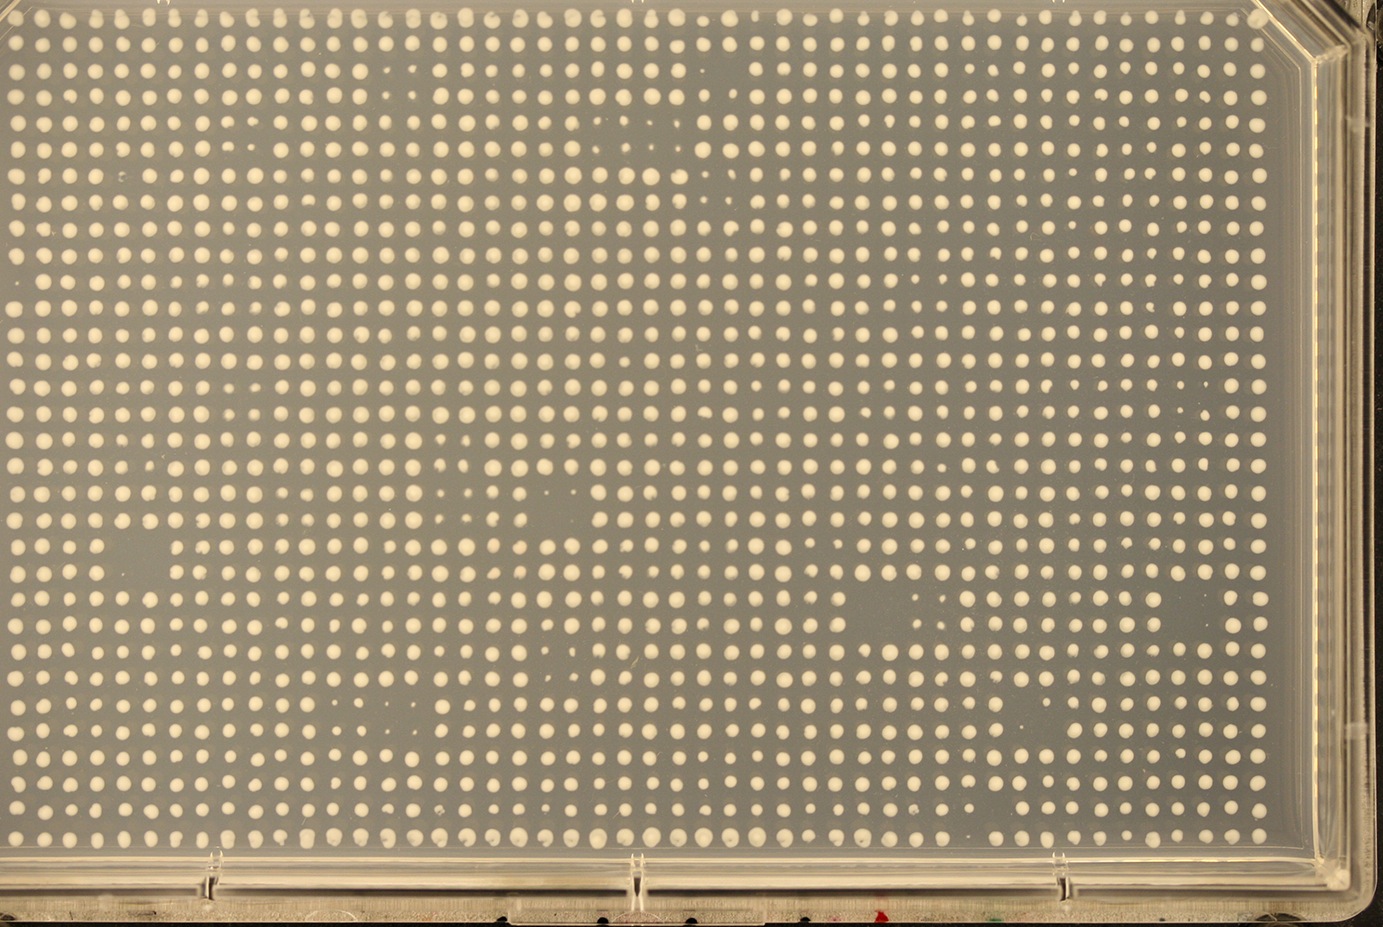
No defined plate edges
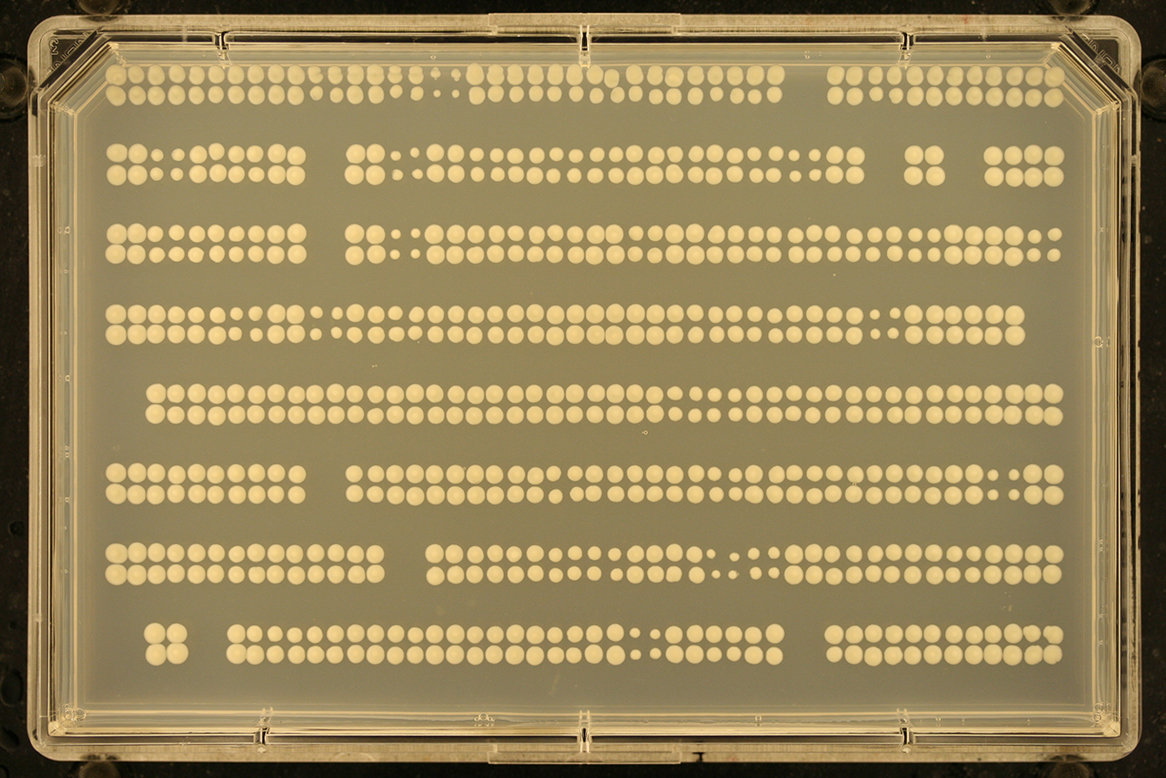
Missing rows/columns
Normalization & scoring
README file provided in the output.
The larger the magnitude of the score, the larger the effect. For reference, scores of about -0.3 can be reliably spotted by eye, and a cutoff of -0.18 was used in a large scale SGA screen. Examples of case-control pairs for different magnitudes are given below:
The p-values give a one-tailed probability of observing the scores in the replicates if the true effect size is zero. This should not be interpreted as the effect strength. The best practice is to not trust the score if the p-value is not very low (as this would indicatelarge variability between replicates). Low p-value by itself is not an indicator of biological significance, as it can be obtained from minute changes in colony sizes that happen to be very concordant.
Data analysis
General
http://www.sgatools.ccbr.utoronto.ca/imageanalysis/48f3b5f6-5f0e-494f-b528-e48ca57d06aeNote: data is only saved on our server for 30 days. After that time period, results will no longer be available
SGAtools.R and has sufficient commenting to get you started.
- Collins, S.R., Schuldiner, M., Krogan, N.J. and Weissman, J.S. (2006) A strategy for extracting and analyzing large-scale quantitative epistatic interaction data. Genome biology, 7, R63
- Shah, N.A., Laws, R.J., Wardman, B., Zhao, L.P. and Hartman, J.L.t. (2007) Accurate, precise modeling of cell proliferation kinetics from time-lapse imaging and automated image analysis of agar yeast culture arrays. BMC systems biology, 1, 3.
- Lawless, C., Wilkinson, D.J., Young, A., Addinall, S.G. and Lydall, D.A. (2010) Colonyzer: automated quantification of micro-organism growth characteristics on solid agar. BMC bioinformatics, 11, 287. (website http://research.ncl.ac.uk/colonyzer/)
- Dittmar, J.C., Reid, R.J. and Rothstein, R. (2010) ScreenMill: a freely available software suite for growth measurement, analysis and visualization of high-throughput screen data. BMC bioinformatics, 11, 353. (website http://www.rothsteinlab.com/tools/screen_mill/cm_engine)
- Bean, G.J. and Ideker, T. (2012) Differential analysis of high-throughput quantitative genetic interaction data. Genome biology, 13, R123.
Workflow
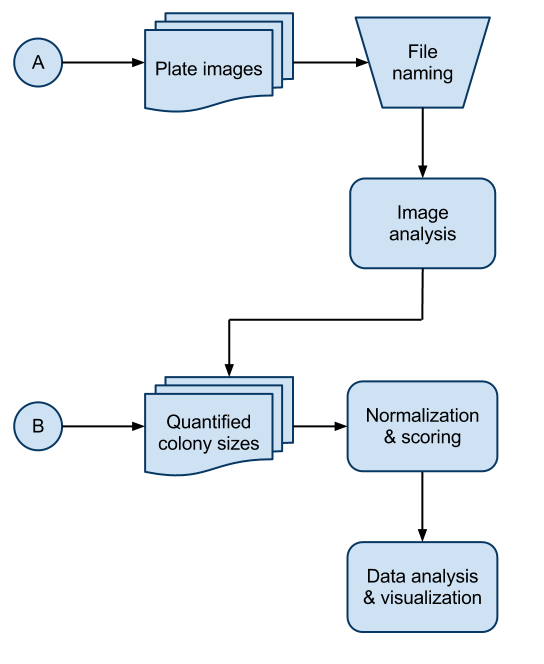
There are three main parts to the SGAtools pipeline. Image analysis, Normalization & scoring, and Data analysis & visualization. There are two possible start points in the pipeline shown as A, starting out with plate images and B, starting out with quantified colony sizes generated by an alternate image analysis software. It is highly recommended that input files at either start point are named using a certain convention in order to maximize functionality
The tabs on the right contain further details on each of the steps of the SGAtools pipeline.
File naming
For analyzing the data from your plates, SGAtools needs additional information about their contents. First, to score the plates after image analysis, the "case" plates (double mutant, drug treatment, etc) are compared against the control, or wild type plates, and have to be labeled as such. Second, to filter out genes linked to the query strain, the query gene name is needed. Finally, if an entire array of plates is screened, the number of the plate in the array has to be provided to link the right case and control plate, as well as to determine which genes are in each plate. extra information can be given in the filename, which should have the format:
- Screen type ― control vs case
- Query name / ORF
- Array plate id
This extra information can be given in the filename, which should have the format:
{username}_{screentype}_{query}_{arrayplateid} …
such that the screen type name is prefixed by wt or ctrl to indicate a control plate.
Anything else will define the plate as a case
You can select which array was used in the screen on the normalization / scoring page.
michael_double-mutant_YDL108W_1_boone_15-12-12.jpg
Indicates a case screen carried out by michael
with the screen having the query YDL108W and an array plate id of 1
charlie_ctrl_YOR341W_9_sga_3-10-11.jpg
Indicates a control screen carried out by charlie
with the screen having the query YOR341W and an array plate id of 9
Note:
- It is not mandatory to name the files in the mentioned format. Files named with a format other than the one mentioned above will not me mapped a query/array ORF and will not be scored
- The first part of the file name before plate type definition does not need to be the user name, but can be any string that does not contain underscores.
Image analysis
Image analysis is the first step of the SGAtools pipeline and involves fitting a grid onto your plate images, then using the bounds of the grid to quantify the colony size using pixel intensities
Input
1. Plate images
-
Images of your screen in
.jpgformat. Images are expected to be an approximate resolution of 160 dots per inch (dpi) and should either be cropped to the size of the experimental plate (i.e. must have plate edges) or have a black background outside of the plate. Note: the higher resolution the image is, the more accurate the quantified colony size is. 2. Plate format
-
SGAtools supports 4 core screen formats
Screen format Number of rows Number of columns Example 1536 32 48 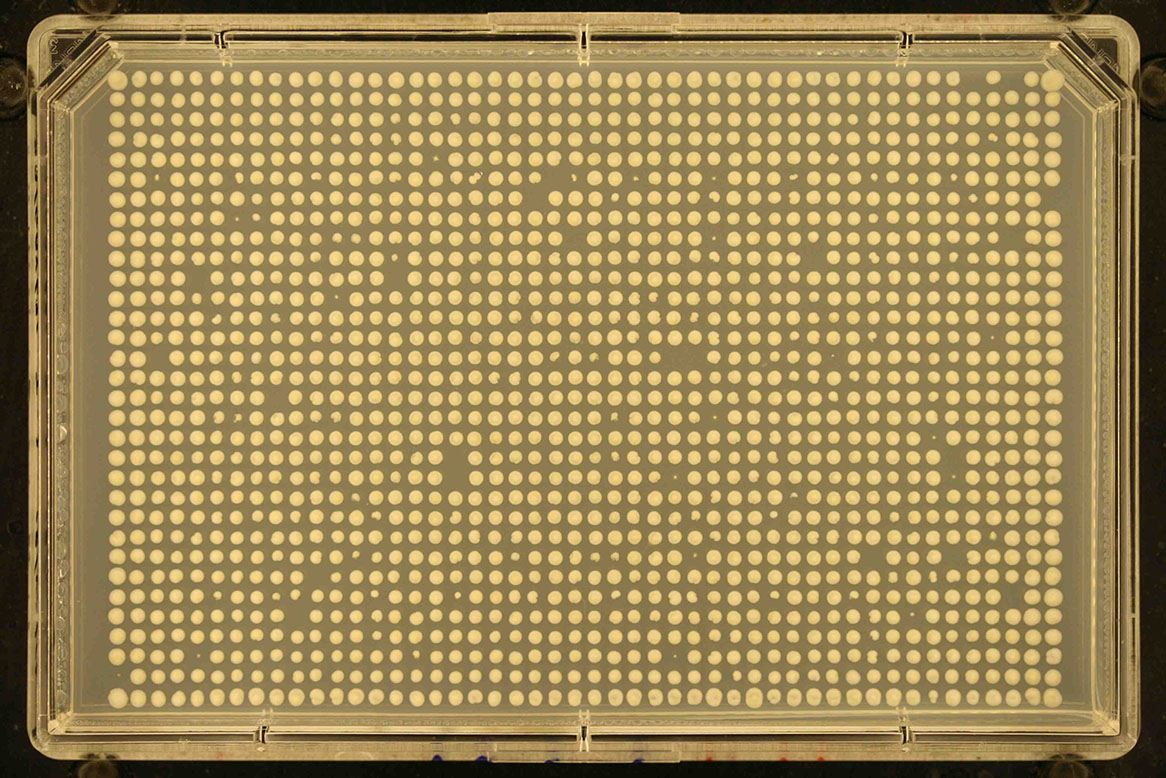
768 -diagonal replicates 16 24 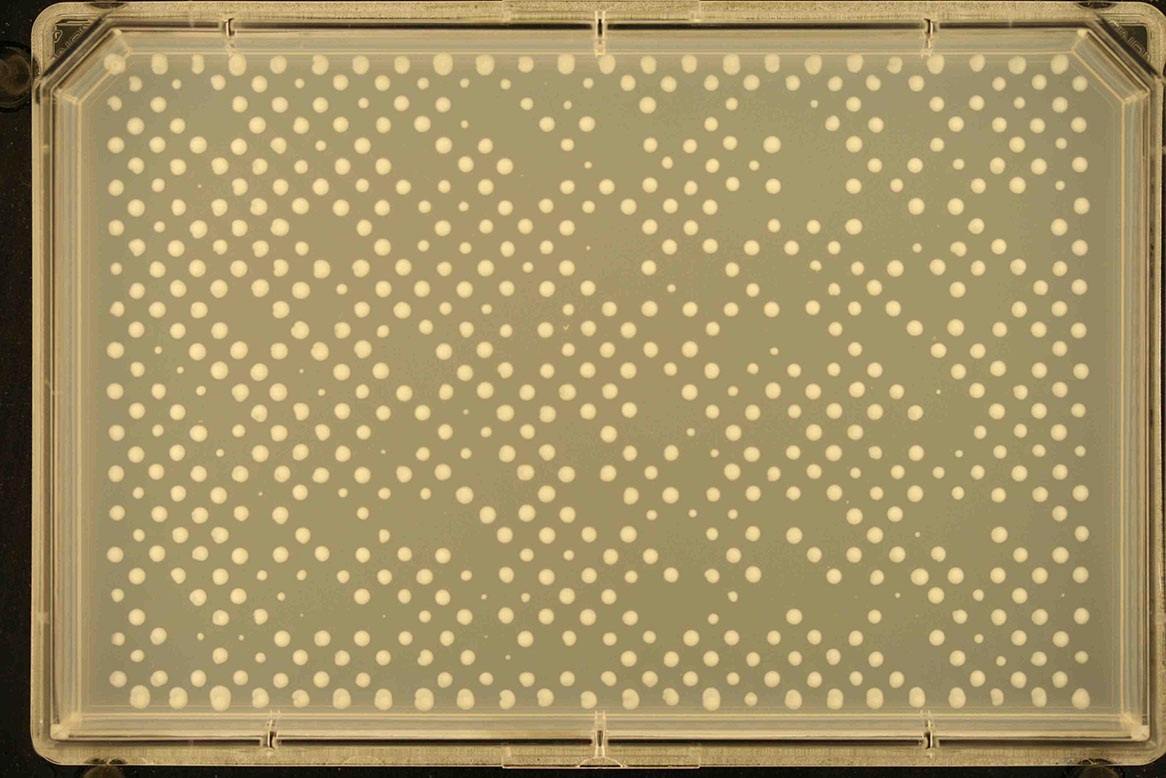
384 16 24 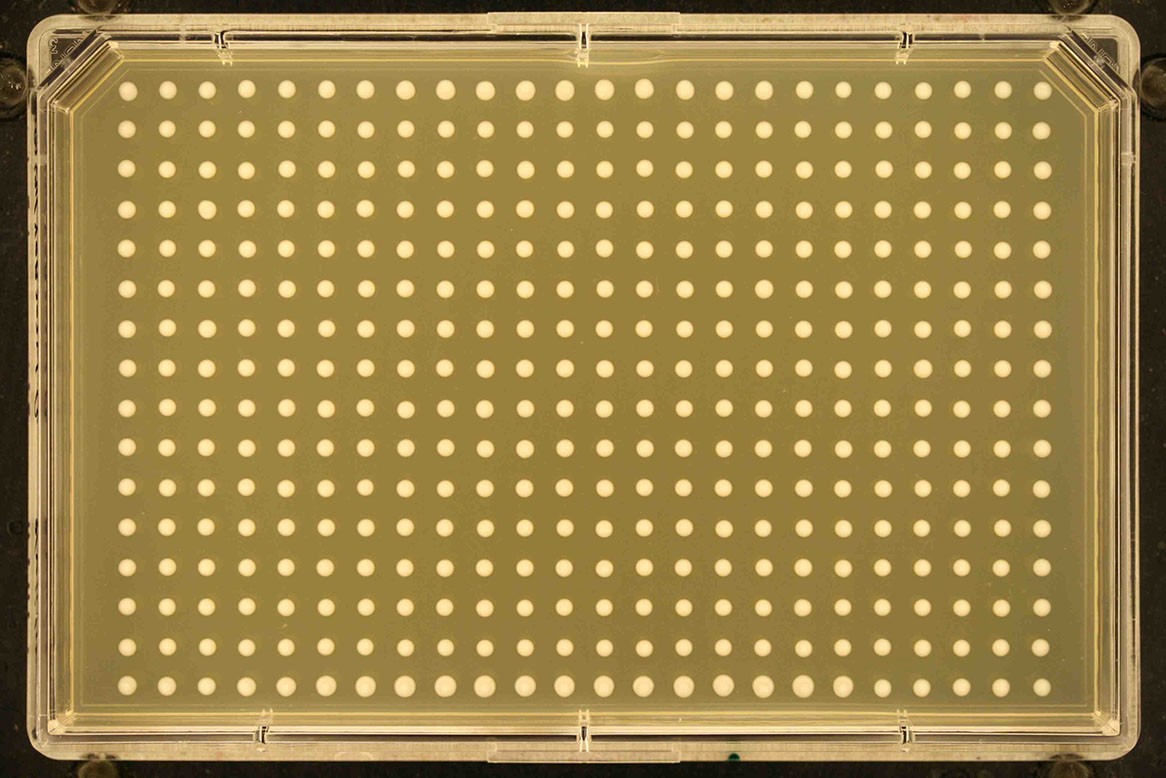
96 8 12 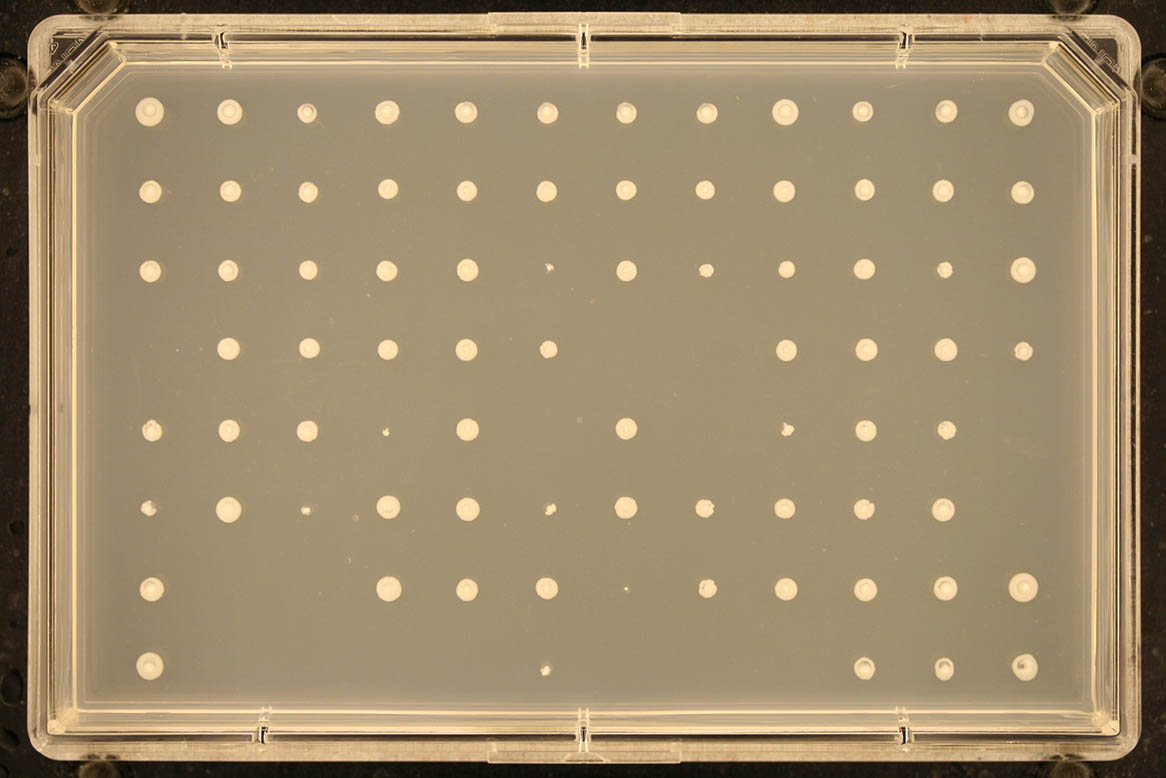
3. Crop option
-
- Automatically choose method (recommended): The program will automatically choose between the other options.
- Always autodetect plate edges: The program will locate the edges of the plate by finding the edge of the black background surrounding the plate.
- Images are already cropped to plate edges: The program will assume that the images have already been cropped to the edges of the agar plate.
3. Noise removal
- Flag indicating if noise/speckles should be removed from the thresholded image prior to analysis.
4. Autorotate
- Flag indicating if image should be auto-rotated prior to processing. Only select this option if image is extremely rotated. gitter is able to handle small variations in rotations (1-2 degrees) without auto-rotating.
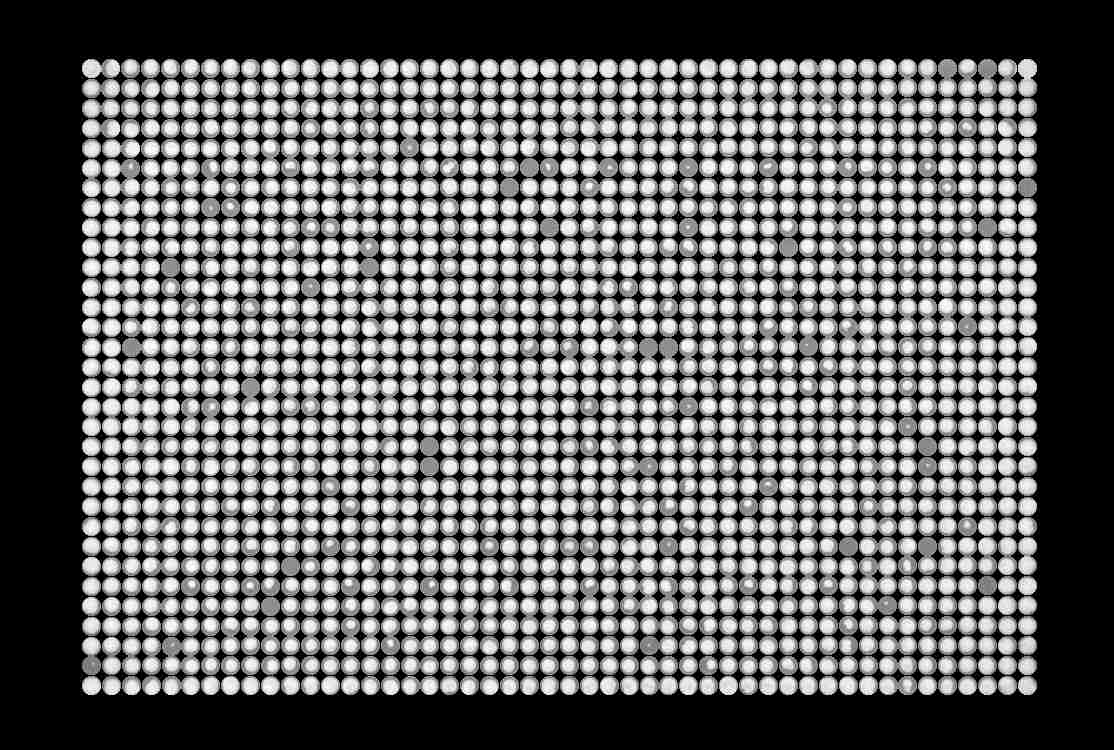
5. Inverse
-
Flag indicating if input image is inverted, meaning colonies are darker compared to their background.
Type Example image Bright colonies on darker background. 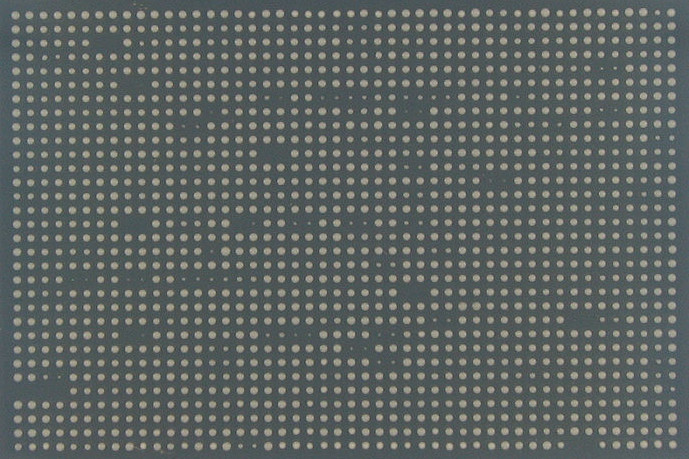
Dark colonies on lighter background 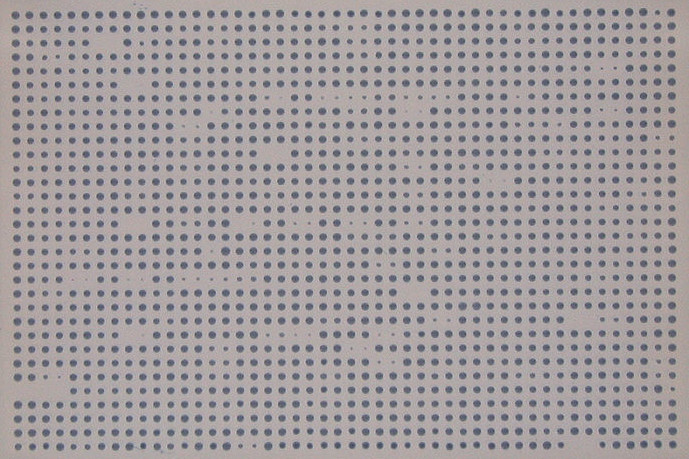
Output
After your images have been processed, you will be directed to a page containing a summary of the analysis. This page allows you to:
- Download the quantified colony sizes
-
The resulting files will be space-delimited and will have the following columns
- Row
- Column
- Quantified colony size
- Circularity
- Median
# This is a comment line and is ignored # row column size-1 circ-1 MedInt-1 1 1 277 0.925 228 1 2 171 0.944 229 1 3 127 0.929 234 1 4 156 0.959 238 ... - Review the gridding applied to your images
-
The gridded image will be displayed.
Hover over the output image for a zoom in on specific colonies to ensure correct gridding
- Proceed to normalization & scoring
- To proceed to normalization, select the desired plates you would like normalized and/or scored and click normalize and score. This will direct you to the normalization & scoring page with your analyzed image data preloaded
Normalization & Scoring
Input
1. Plate files
-
The main input to normalization & scoring is the quantified colony sizes in a space-delimited file with 3 or more columns as follows:
- Row
- Column
- Quantified colony size
Note: In the example above, the circularity column and any column that follows it are ignored# This is a commented line and is ignored # rows columns size circularity: 1 1 2205 0.981750 1 2 1734 1.065585 1 3 1996 1.057621 1 4 1704 1.032656 1 5 1755 1.109302 ... 2. Plate layout file
-
This file allows a mapping from row and columns to a gene name. If an array layout file is not selected the array column in results will contain numbers, such that each number represents a group of replicates.
There are two ways of selecting an array layout file:- Selecting a predefined plate layout
- You can select between commonly used arrays from the drop down menu.
The number of the plate detected from the file name (e.g. plate 4 for
user_ctrl_YOR101W_4_130301.jpg) is matched to the corresponding plate in the array, and the output is populated with the names of the strains in the plate. - Uploading a custom plate layout file
- Select the "Upload custom" option for plate definition, and upload your file.
The format for the plate definition file is three tab-delimited columns:
- Column
- Row
- Gene name
# This is a comment line and is ignored
# c	r	Gene
1	1	HIS3
1	2	HIS3
1	3	HIS3
2	1	HIS3
2	2	RKM3
2	3	YPK3
3	1	HIS3
3	2	TPS1
3	3	GAL1
...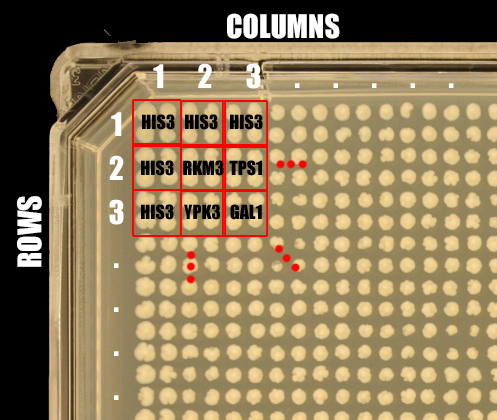
3. Replicates
-
This is the number of replicates in the experiment.
A value of4indicates replicas are in quadruples
A value of1indicates there is only one replicate 4. Linkage correction
- This step ignores interactions between genes within a specific proximity to one another on the same chromosome from the analysis as it is considered an artifact. The proximity is provided in kilobases (KB) as the linkage cutoff
5. Score results
-
If this option is selected, a score will be computed for non-control plates with a corresponding control plate of the same array plate id.
There are two ways SGAtools can score screens:
Output
After your data has been normalized and/or scored, you will be directed to a page containing a summary of the analysis. You will be able to:
- Download your processed data files
- These files will be tab-delimited with 9 columns as follows:
- Row: the row of the colony
- Column: the column of the colony
- Raw colony size: the size of the colony as quantified by the image analysis software
- Plate id: unique id for this plate, set as file name
- Query gene name/ORF: Name of the query ORF if image/dat files follow conventional file naming (see file naming in help). If they do not, a value of '1' is placed as the query ORF
- Array gene name/ORF: Name of the array ORF if plate layout file supplied. If not, a unique value is assigned to each group of replicate arrays
- Normalized colony size: the raw colony size after normalization. The size is relative to plate median colony size, and a proxy for fitness. Normalized value of 1 is as fit as the average strain, 1.3 means it is 30% fitter than the average strain, and 0.4 that it's 40% as fit as the average strain.
- Score: the colony fitness score computed using the normalized colony size (7) and the corresponding normalized colony size in the control screen
- Additional information as key-value pairs
# This is a comment line and is ignored
# row	col	size	plateid	query	array	norm	score		kvp
3	6	196	file-name	Y8835	YBR138C	523.39	-0.008	NA
3	7	173	file-name	Y8835	YBR028C	448.31	-0.0975	NA
3	8	205	file-name	Y8835	YBR028C	526.61	0.0557	NA
3	9	181	file-name	Y8835	YBR137W	NA	NA	status=JK
3	10	198	file-name	Y8835	YBR137W	520.88	0.0647	NA
3	11	186	file-name	Y8835	YBR027C	489.08	-0.044	NA
3	12	191	file-name	Y8835	YBR027C	501.44	-0.020	NA
3	13	172	file-name	Y8835	YBR134W	NA	NA	status=JK
3	14	204	file-name	Y8835	YBR134W	534.83	0.0286	NA
...
Additional information returned from SGAtools includes status codes for colonies that did not meet a filter. The codes and their corresponding descriptions are listed below:
Status code Description SD Standard deviation of scores (in the combined file) PV P-value gives a measure of reproducibility of the effect across the replicate colonies (in the combined file) LK Linkage correction: The array exists too close to the query on the chromosome JK Jackknife filter: This colony induces too much variance in the sizes of other colonies in the replicate group BG Big replicates: At least three colonies of this replicate are too large. The whole replicate is excluded CP Cap: Normalized colony size was too large (> 1000) and was capped at 1000 - Visualize your results
- To proceed to data analysis, click data analysis. This will direct you to the data analysis page
Data analysis
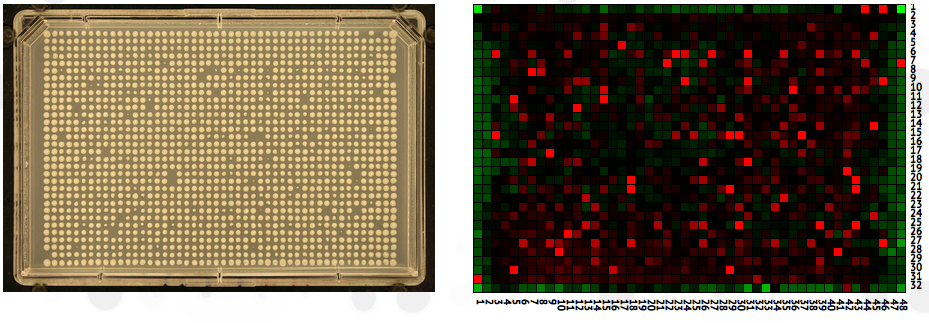
This is the final step of the SGAtools pipeline and involves visualizing your processed data. There are two visualizations available:
- Heatmap: If you analyzed your images with SGAtools, your plate will appear adjacent to a heatmap of your processed data.
Hover over the heatmap for details of colonies
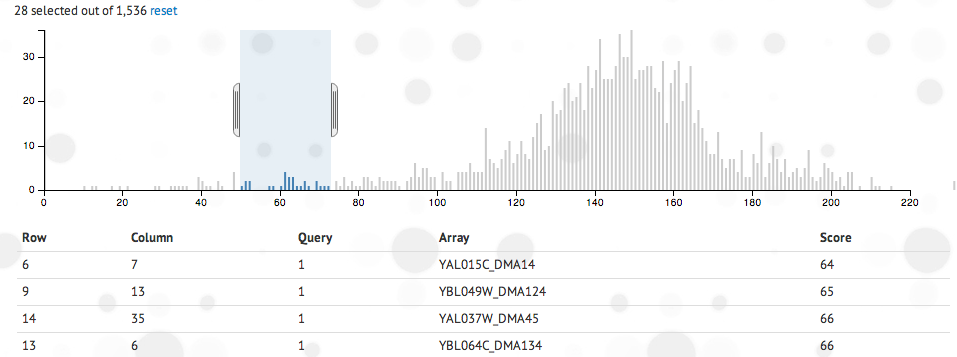
- Histogram: An interactive histogram of the data is shown.
Click and drag the histogram to create a window of data you would like to inspect
There are 3 types of processed data you can visualize:
- Raw colony sizes: The colony sizes as quantified by the image analysis software
- Normalized colony sizes: The colony sizes normalized by SGAtools
- Score: Colony score against control plate (this is only available if the plate is not a control and sufficient data was provided to score)
Select a specific plate from the drop down and the type of data you would like to visualize. You can also adjust the range of values to be displayed.